


DiFluid Omni Complete Guide
Part 1: The device
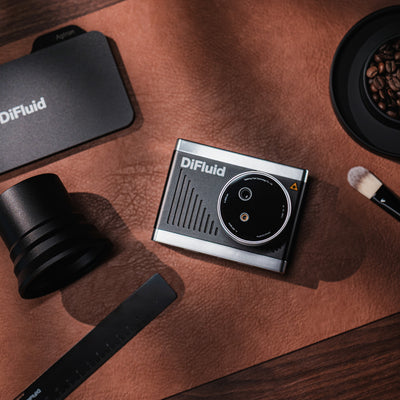
Omni measures the complete distribution of both ground coffee particle size and roast color. Everything below is about getting a reading you can trust, and making the most out of that reading using CoffeeOS.

What’s in the box
Omni Main Unit × 1
Particle Analysis Base × 1
Roast Analysis Dish × 1
Tray × 1
Calibration Plate × 1
USB-C Charging Cable × 1
Coffee Spoon × 1
Coffee Ground Spoon × 1
Scraper × 1
Brush × 1
Velvet Bag × 1
Protective Film × 1
Toolbox × 1
Test Report × 1
Manual (including warranty card) × 1

Device anatomy

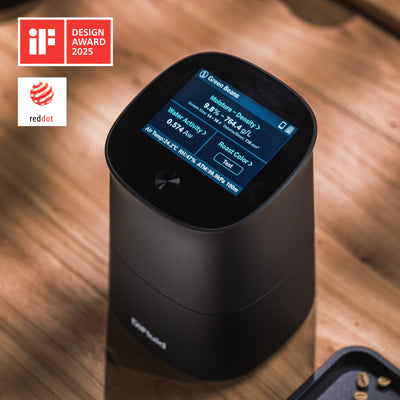
Touchscreen - the whole face of the unit. It shows READY when the device is idle, walks you through a reading, and is how you move between roast, particle, calibration, and settings.
Button - the single control below the screen. It powers the device on and off and starts a test.
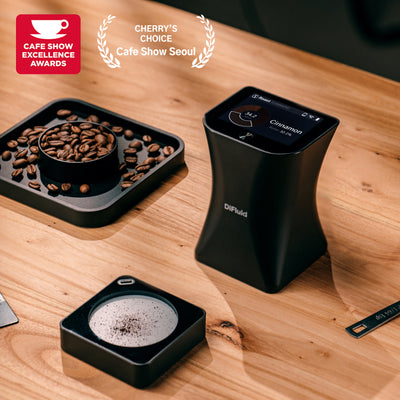
Three pieces make up the tray system.

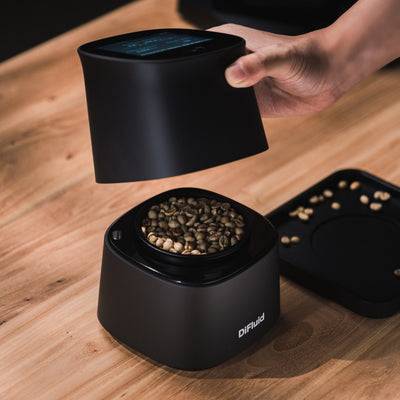
Particle Analysis Base - the square base with the USB-C port and the magnetic connector. It connects to the Main Unit electronically: snap the Main Unit on and Omni switches to grind-size measurement. Omni also charges through this base when the Main Unit is attached and the base is plugged in.
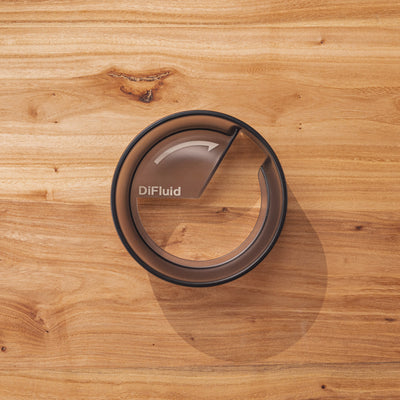
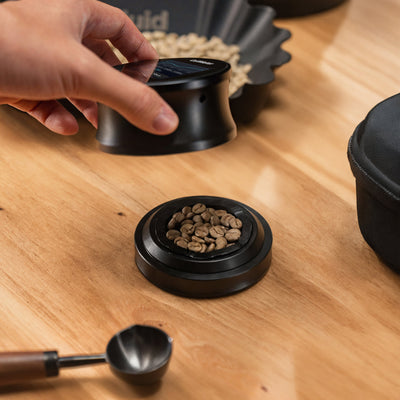
Roast Analysis Dish - the flip dish for roast color. The deeper side holds whole beans; flip it over and the shallower side holds grounds.
Tray - the square tray the Roast Analysis Dish sits in. It catches loose beans and grounds while you prepare a sample.
How the mode is chosen. With the Particle Analysis Base attached, Omni runs grind-size analysis: the base connects electronically and tells the Main Unit to run a particle test. With no base connected, Omni always defaults to roast color, auto-detecting whether the sample is whole bean or ground coffee.
The button
| Press | What it does |
|---|---|
| Press once (device off) | Powers on. When the screen reads READY, it has finished booting. |
| Single tap (device on) | Takes a reading, the same as tapping the screen on the home page. |
| Quick tap, then hold | Brings up the roast color calibration page. Do it at speed, like a double-click where you hold the second press. |
| Double tap | Shows device information. |
| Long press | Powers off. Hold until “Power Off” appears, then release. |
Moving around the screen
READY is home. Tap the screen from this page and Omni runs a test, deciding whether to read roast or particles based on the circumstances.
- Swipe right from home to reach the menu: Roast, Particle, Calibration, Settings. Pick one to run that reading directly instead of letting the device choose.
- Swipe left from home to see your last roast result. Swipe left again for your last particle result. Swipe down on either to open its full history.
- On any sub-page, swipe right to step back up a level.
Charging
Power comes in through the Particle Analysis Base. Attach the main unit to the base and plug the USB-C cable into the port on the side of the base. If you turn Omni on while it is charging it shows a DiFluid screen, then the charging page; press the button once more to get back to READY. A full charge covers a long session of readings using the 2500 mAh battery.
Calibration
Calibration standardizes the color reading against a known reference. Omni ships with its own calibration plate matched to that unit, so do not swap plates between devices. Take the protective cover off the plate before you start.


- Take the protective cover off the calibration plate.
- Power on and set the main unit over the plate.
- Swipe right to the menu and tap Calibration, or start it from the button with a quick tap then hold. The screen reads “Success” when it finishes.
Lost the plate? Each plate is unique to its unit, so a generic one will not work. Reach out to customer service to order a replacement matched to your Omni.
Measure roast color
Roast color uses the Roast Analysis Dish with no base attached. Omni images the beans under near-infrared light and reports an average Agtron number alongside the distribution, and a description of the roast level according to your chosen standard. Reading whole beans and grounds from the same coffee using CoffeeOS will determine your Roast Delta: how evenly the roast developed from the surface inward. For a more in depth understanding of roast color, click here.

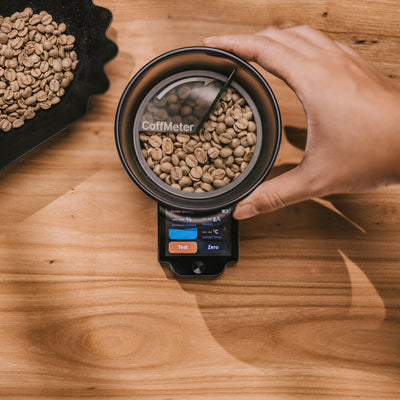
Use the deeper side of the Roast Analysis Dish for whole beans. Fill it, then run the scraper across the rim so the beans sit as flush as possible. A level, full surface is what keeps the reading repeatable.

Power on, set the main unit over the Roast Analysis Dish, and tap the screen, or swipe right and tap Roast. The result shows the average Agtron, the roast standard it maps to, and the distribution across the sample.

Turn the Roast Analysis Dish over to the shallower side, fill it with grounds of the same coffee, level it, and read again. Now you have both numbers to compare.
The result page packs a lot into one screen. Here is what each part is telling you.

Average - the headline Agtron value, the one that stands in for the whole sample. Lower is darker. This is the number CoffeeOS pulls when you import a roast color.
Standard deviation - how tightly the sample clusters around that average. A smaller number means a more uniform roast; a large one means the beans roasted unevenly.
The roast standard name comes straight from the Agtron value using the table further down (Full City, City, and so on), so you can talk in either numbers or names.
Measure grind size
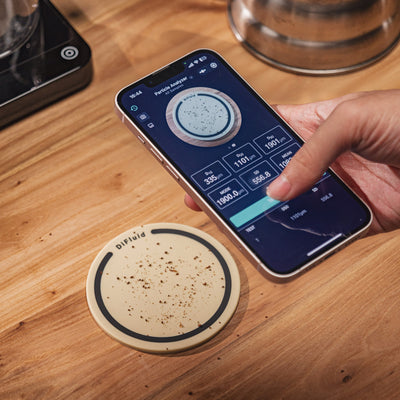
Grind size uses the Particle Analysis Base. Scoop grounds into the middle, and Omni spreads them out and photographs the spread to work out the size distribution. The 1/64 teaspoon in the box is a starting point, not an exact dose: how much you use depends on the grind, so read it and adjust rather than filling to a set line. Never overfill. With a lot of fines, use less so the particles have room to spread out. With larger particles you can use more, because the auto-dispersion pushes some to the sides and still lands an even, readable layer; when the grind is very coarse it comes down to how many large pieces happen to fall into the scoop. Either way, too much coffee crowds the finer particles and skews the reading.


Scoop grounds into the center of the Particle Analysis Base with the coffee ground spoon. Match the amount to the grind, as above: less when there are lots of fines, a little more for coarser grinds, and never a heaped scoop.

Set the main unit on the base so the magnetic ports meet, then tap the screen or swipe right and tap Particle. The base vibrates to scatter the grounds into an even layer. If you spread the grounds manually with a brush, the auto-disperse feature will not activate.

Omni reports the D50 median size, the grind standard it falls into, the particle count, and the full distribution. Use CoffeeOS for more detailed information.
How auto-disperse works. Each test is really several. Omni vibrates the base and photographs the grounds a number of times, then reports the frame with the highest particle count. A shake spreads a center clump into an even, readable layer, and that best frame is the one it keeps. If the grounds already look spread, it assumes you dispersed them on purpose and measures without shaking; you can also switch auto off in settings to disperse by hand only.
This is why an immediate retest of the same, untouched sample can read a little lower. The grounds are already at their most-dispersed from the last shake, so another shake tends to push particles toward the edges and out of the frame, leaving fewer to count. That is not an error, just a different frame. So treat no single test as the final word: run several tests per sample and rely on the CoffeeOS average rather than any one number.

When auto-disperse fights the grind. With a very coarse grind the shake can fling the big particles to the rim, where they drop out of the count, and the grounds read far finer than they are. Pull them back to the center and the average jumps. There is no single right answer here, which is the point: run several tests, and confirm auto-disperse actually suits the grind you are measuring before you trust one reading.


D50 - the median particle size, in microns. Half the grounds are finer, half coarser. This is the single number CoffeeOS imports for grind size.
Standard deviation - the spread of the grind. A smaller number is a more uniform grind, which is usually (but not necessarily) what you are chasing.
Roast and grind standards
Omni reports both a number and a named standard. These are the tables it uses, so you can read a result either way.
Roast color (Agtron)
| Agtron value | COMMON | SCA |
|---|---|---|
| 0 – 30 | Espresso Roast | Very Dark |
| 30 – 40 | French Roast | Dark |
| 40 – 50 | Full City Roast | Medium-Dark |
| 50 – 60 | City Roast | Medium |
| 60 – 70 | Dark Roast | Medium-Light |
| 70 – 80 | Medium Roast | Light |
| 80 – 90 | Cinnamon Roast | Very Light |
| 90 – 150 | Light Roast | Extra Light |
Grind size (D50)
| Particle size | Grind |
|---|---|
| 100 – 500 µm | Fine |
| 500 – 800 µm | Medium Fine |
| 800 – 1100 µm | Medium |
| 1100 – 1400 µm | Medium Coarse |
| 1400 – 2500 µm | Coarse |
Sieve reference
| ISO pore size (µm) | ASTM sieve | American sieve |
|---|---|---|
| 300 | 50 | 48 |
| 425 | 40 | 35 |
| 600 | 30 | 28 |
| 850 | 20 | 20 |
| 1180 | 16 | 14 |
| 1400 | 14 | 12 |
| 1700 | 12 | 10 |
| 2360 | 8 | 8 |
Omni Specifications
| Specification | Value |
|---|---|
| Type | Professional roast and particle analyzer (2-in-1) |
| Dimensions (L × W × H) | 109 × 79 × 72 mm |
| Weight (main unit) | 290 g |
| Screen | 2.8-inch HD touchscreen |
| Battery | 2500 mAh rechargeable lithium |
| Light source (roast) | Multi-band near-infrared (850 nm, 940 nm) |
| Optical sensor | Two-dimensional imaging sensor |
| Data records | 500 roast analyses, 500 particle analyses |
| Operating temperature | 0 – 45°C |
| Charging port | USB-C |
| Charging | 5V, 1A |
Part 2: Omni in CoffeeOS
A reading on Omni’s own screen is useful in the moment, but for analysis and long term data management, use CoffeeOS. Omni can be used with the Roast Color Analyzer, Particle Analyzer, Brew Recorder, Brew Controller, and Grinder Manager. Data from Omni can be dropped straight into any recipe or field that asks for roast color or particle size. This part covers everything you need to know to use Omni effectively with CoffeeOS.
Pairing Omni
Power on Omni while on the CoffeeOS Tools tab and a connection prompt appears; tap Connect. If you are already inside a tool, open Device Center from its menu (three dots at the top right), select Omni, and connect. Once paired, Omni shows up along the top row of the home screen for quick access to its hardware settings.
Two ways to import a reading
Every field in CoffeeOS that takes roast color or grind size will accept a live reading from Omni. You can also choose to open a full analyzer (for example, the Particle Analyzer) for a multi-sample average that can then be imported to the text field.

Roast color takes a name or a number. Enter it as a Roast Description (City Roast) or as an Agtron Value, whichever you think in. “Fill from Brew” allows you to import the value from a previous brew, so you are not re-measuring coffee you have already read.
Filling roast color with Omni
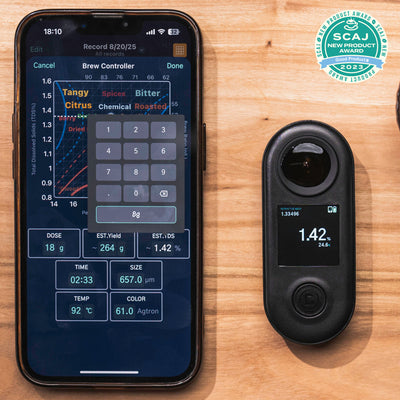
Tap the Roast Color field and choose Agtron Value. A keypad opens with two icons beneath the digits. The device-import icon connects to Omni and will pull live readings straight from Omni. Tapping the device-import icon will either highlight the icon in a green frame, or open the device center if Omni is not currently connected. Tapping the Roast Color Analyzer icon opens Tool, where you can take several samples and import the average.

A single live import is fastest and fine for a quick check. Going through the analyzer imports the average of several tests and keeps every test on file, resulting in greater accuracy.
Filling grind size with Omni
Grind size works the same way. The device-import icon pulls Omni’s D50 from a single test, and the analyzer icon opens Particle Analyzer for multiple samples. Either way the value lands as a D50 in microns.
Roast Color Analyzer
Roast Color Analyzer averages many whole-bean tests and many grounds tests under a single Session of one bean sample, and compares them. Use this Tool to understand how a roast developed.


Roast delta - the average whole-bean Agtron minus the average grounds Agtron. Grounds usually read lighter because you are seeing the bean’s interior, where heat reaches more slowly.
Peak shift - how far the peak of the grounds distribution sits from the peak of the whole-bean distribution. A large shift flags an uneven roast (not necessarily a bad thing!).
Uniformity delta - the difference between the two spreads, another angle on how uniform the roast was bean to bean.
Each test is tagged as whole bean or grounds, either auto-detected or set by hand, and you can drill into any single test. Pick a band on one distribution, say 90 to 100 Agtron, and the same band lights up on the other so you can compare easily.

Particle Analyzer
A Particle Analyzer Session holds as many tests as you want to run, and each test reports D10, D50, and D90, the mode, mean, and standard deviation, a per-sieve breakdown, and the distribution graph. Selecting a single test will show you that test’s data, and deselecting will show you the average across all tests.


Set your sieves. The sieve stacks are editable in the tool’s settings; add ASTM or ISO sizes in any mix so the breakdown matches the standard you work to.


No Omni handy? Swipe left to the camera mode and use a Particle Analysis Coaster to run a distribution from a photo, without the device.
Building and calibrating grinders
Omni also fills the micron blanks in Grinder Manager. When you build a grinder you enter its finest, middle, and coarsest settings each paired with a measured size; pull each of those live from Omni. Re-measure the same settings over time and Grinder Manager tracks how that individual grinder drifts.
For the full walkthrough, see the guide on setting up a grinder in Grinder Manager.
Where your readings live
Assign a bean to a session, using Assign Beans in the Tool Controller, and every Session files itself under that bean.


Bean Insights groups sessions into folders by Tool, so your roast color testing session sits in the Roast Color Analysis folder, your latest grind analysis session in the Particle Analysis folder, each with a count. Saved recipes for that bean sit under Selected Recipes, one tap from brewing again.

All of it shares the same way as everything else in CoffeeOS: tap share, and a QR code and link carry the bean and whichever readings you choose to bring along to anyone else running CoffeeOS.