





5 Green Bean Metrics That Quietly Decide Your Cup Score
A field guide from DiFluid
Why the green decides the cup before you ever hit first crack
Most roast troubleshooting starts at the wrong end. When a batch comes out baked, scorched, flat, or just inconsistent from one bag to the next, the instinct is to adjust the roast curve, change the charge temperature, stretch the development, chase the problem inside the drum. Sometimes that's where it lives, but frequently, it isn't.
A green coffee is not a fixed input. Two lots of the same variety, same origin, same process can carry different amounts of water, pack to different densities, vary in bean size, and sit at different points on the storage-stability clock. Each of those differences changes how the bean accepts heat. Feed an unmeasured green into a fixed profile and the profile quietly does something different every time. Not because your roasting drifted, but because the thing you were roasting did.
The fix isn't more roast data, it's knowing what you're putting in. Five green-side properties carry most of that information, and none of them are visible by eye or guessable by feel. Here's what each one is, how it bends roast behavior, and what to do when it drifts off.
1. Moisture content
What it is. The percentage of water held inside the bean by weight. Green coffee is hygroscopic; it trades water with the air around it for its entire storage life, so moisture is less a fixed property of the lot than a snapshot of where it sits today.
Why it moves the roast. Water is the bean's thermal buffer. Through the drying phase, energy goes into evaporating that water before bean temperature can climb toward the Maillard and caramelization reactions that build flavor. A wetter bean absorbs more energy early and stalls; a drier bean races through drying and arrives at first crack underdeveloped on the inside. Hold your usual profile across a moisture swing and you've effectively changed the roast without touching a dial: one batch bakes, the next sprints. You can try to make changes during the roast to catch up, but more often than not, the damage has already been done.
Values to watch. The widely accepted window for stable, roast-ready green sits around 10–12%, with most roasters targeting the middle of that band. The absolute number matters less than knowing it and tracking it lot to lot.
What goes wrong when it drifts. Above roughly 12–12.5%, you're carrying risk in storage, and with sluggish, uneven drying. Below about 9–10%, the bean is brittle and over-dried, roasts fast and hollow, and tends toward a flat, papery cup with muted acidity. Drift shows up at the source too. In high-price years, when the incentive to do the careful work at the farm slackens, lots arrive above their contracted spec, 13 to 14% against an agreed 11%, carrying both storage risk and a different roast than you planned for. Measuring on arrival is how you catch that. It helps to know what a moisture reading actually is.
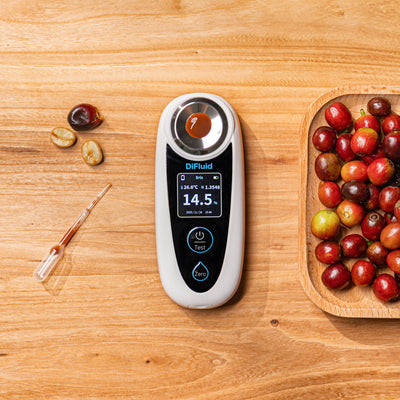
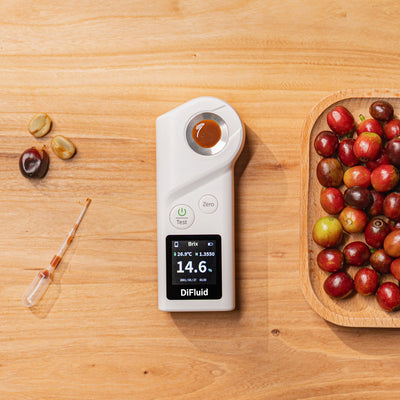
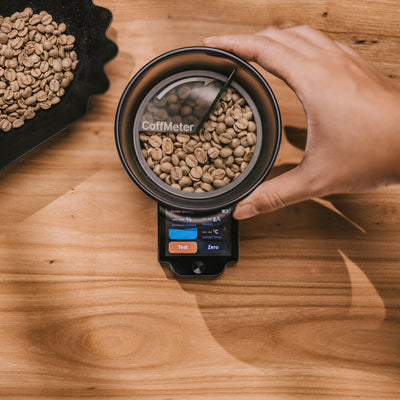
The honest moisture reference, the one labs treat as ground truth, comes from weighing a sample, baking it until the water is driven off, then weighing it again; whatever weight it lost was the water. That is the most accurate, but it's slow and it destroys the sample, so running it on every lot would be both wasteful and unnecessary. Faster tools, Omix Plus among them, reach the same answer a different way: water responds to an electrical field far more strongly than dry plant matter does, so reading how the beans react to a small field, together with the weight of the sample, gives a value that tracks closely with the oven result. The readout is a careful estimate of that reference, not a separate, independent fact. That is why two reliable devices can show slightly different numbers on the same coffee, and why neither one is broken. Each is calibrated to the same standard in its own way and under its own conditions, so the absolute figure can shift a little from method to method. This is simply how moisture measurement works, all the way up to laboratory equipment; every tool approximates the one agreed reference rather than reading water directly. So the number to trust is not whether your device matches someone else's, but whether your own readings stay consistent over time. Measure the same coffee the same way with the same tool, and your lots become comparable to each other, which is what a roast decision actually rests on. That consistency is the point of Omix Plus: a fast, repeatable moisture reading, held to ±0.1% against the oven-dry reference and steady to ±0.1% across repeats.

2. Water activity
What it is. Not how much water is in the bean, but how much of that water is chemically free, available to drive microbial growth and chemical reactions. It's reported on a 0 to 1 scale (aw), and it's a different question from moisture content. Two lots can read the same moisture and sit at very different water activity.
Why it moves the roast and the cup. Water activity is the better predictor of how a green will age and how stable it is in storage. Free water fuels the slow chemical reactions that flatten a coffee over months and the microbial activity that spoils it. A lot trending high will lose its top notes and degrade faster than its moisture reading alone suggests, so the lot you bought is not the lot you'll be roasting in three months.
Values to watch. The practical safe-storage ceiling is around 0.60 aw, with many quality-focused buyers treating roughly 0.50–0.55 as the sweet spot for holding a coffee at its peak. There's a flavor reason to favor the upper end of that safe band, not just a storage one: more free water gives the Maillard and caramelization reactions more to work with and helps preserve sweetness, acidity, and body, so coffees held near the ceiling often cup rounder and more complex than over-dried lots that have dropped low, though the relationship isn't linear and pushing past the ceiling undoes the gain.
What goes wrong when it drifts. Push past 0.60–0.65 and microbial risk climbs sharply along with fast staling; the coffee is on a clock you can't see. Drop well below 0.40 and you're typically looking at an over-dried, aged-out lot that has already given up its aromatics, the point at which enzymatic activity effectively stops.
This is where reposo earns its attention. Reposo is the rest a green coffee takes after processing, before it's milled and shipped, letting moisture and water activity settle rather than leaving origin while still in flux. Recent high-altitude research split a single Bolivian lot in half, rested one half for eight weeks at 4,100 meters, and shipped the other immediately. Tracked over years, the rested lot held more stable water activity and stayed markedly less reactive to storage swings, while the unrested half eventually slid below 0.40 aw during a dry winter. The proposed mechanism is plain: thinner air carries less oxygen, which slows the living seed's respiration and the slow self-consumption that ages it. You can't reposo a coffee that's already in your warehouse, but you can read water activity on intake and through storage and let it tell you which lots are stable and which are on a faster clock.
Omix Plus measures water activity by the chilled-mirror dew point method, the same AOAC-certified, internationally traceable approach used by laboratory reference instruments, accurate to ±0.01 aw and repeatable to ±0.005, with results in about 30 seconds. A correct calibration against saturated salt reads between 0.745 and 0.755.
3. Bulk density
What it is. How much mass a known volume of beans packs into, reported in grams per liter. It folds together how dense the bean material is and how the beans nest together. As a rough proxy it tracks growing altitude and bean hardness; high-grown coffees tend to be denser, harder, and slower to give up their structure.
Why it moves the roast and the cup. Density sets how heat travels into the bean. A dense, hard bean resists conduction; it wants more energy and more time to develop evenly to the core, and underfed it roasts dark on the surface while staying green inside, the classic tipping and scorching over a grassy center. A lower-density bean takes heat fast and is easy to push past the target, sliding toward baked and dull. Decaf makes the stakes obvious: the decaffeination cycle swells and then shrinks the bean, densifying it while leaving a damaged, less uniform pore structure, so it starts the roast behaving like a high-density coffee but gives up that structure partway through and finishes fast like a low-density one, which asks for a different hand on the gas as the roast develops.
Values to watch. Green coffee bulk density commonly lands in the neighborhood of 600–720 g/L, with the harder high-grown lots at the top of that range. What you're after is knowing where each lot sits so you can match the heat application to the bean rather than running one profile across all of them.
What goes wrong when it drifts. Treat a denser lot like your usual green and you under-develop the core; treat a lighter lot the same way and you bake it. The cup reads either green and sharp or flat and lifeless, both of them heat-management problems wearing the costume of roast inconsistency.
Omix Plus reports two density numbers. Bulk density is the straightforward one, sample weight divided by container volume, which captures how the beans pack, the property your heat application actually meets. True density is harder to get at: Omix Plus images the packed sample, uses a model to find and subtract the air gaps between beans, and reports what's left, the density of the bean material itself, modeled against the water-displacement reference and typically above 1000 g/L for green. Read together they say more than either alone. Bulk density sets your roast approach, while the gap between bulk and true reflects how porous the bean is and how it will expand. Tracking density against moisture over time also separates two things a moisture meter alone can't: if moisture falls and density rises, the bean is simply losing water; if moisture falls and density holds, the living bean is consuming its own stored compounds, the exact signature the reposo researchers used to confirm green coffee ages from the inside, not just off the surface.
4. Screen size distribution
What it is. The spread of bean sizes in the lot, traditionally read against sieve screens. The number that matters is not just the average size but how tightly the beans cluster around it, the width of the distribution.
Why it moves the roast and the cup. A drum applies one heat environment to whatever's inside it, but a small bean and a large bean don't respond the same way. Mixed sizes roast at different rates in the same batch: the smalls run ahead and risk scorching while the larges lag and stay underdeveloped. The result is a single roast that is really several roasts at once, and the cup averages them into something muddy, with competing notes, an unclean finish, and acidity and body that won't line up. Even a flawless curve can't rescue a bean population that won't roast in step.
Values to watch. Absolute screen size varies by origin and grade and isn't the point. Uniformity is. A narrow distribution roasts evenly; a wide one fights you no matter how good the profile. Where size is genuinely bimodal, the honest fix is to sort and roast the fractions separately. It surfaces in blending too: substitute a lower grade within an origin to manage cost, and you can quietly widen the size mix, and the roast along with it.
What goes wrong when it drifts. A distribution that widens lot to lot, or a "single" grade that's quietly mixed, shows up as a roast you can't get clean and a cup that never quite resolves. Without measuring it, that reads as a mysterious quality problem rather than a sizing one.
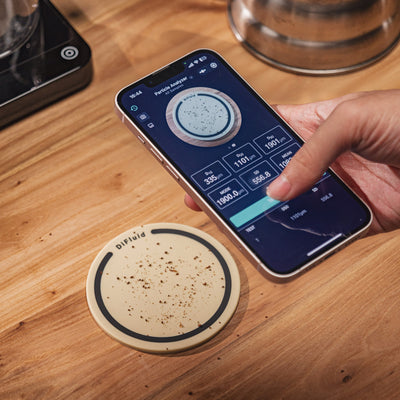
Omix Plus returns screen size as a distribution from a deep-learning model trained on bean short-axis imaging, validated so the physical sieve value falls inside the reported range, and repeatable enough that three runs return an unchanged result.
5. Roast color: where the green finally shows itself
What it is. Color measured on the Agtron scale as a full distribution, not a single number, read on the roasted output rather than the green. It's the fifth metric because it's where the first four come home. Everything green variance does to a roast eventually prints as color: how far development went, and how evenly it landed across the batch.
Why it matters. A single average color hides the thing you actually need to know, which is whether the beans roasted together. Two batches can share an average Agtron number while one is uniform and the other is a mix of scorched and underdeveloped beans dragged to the same mean. That spread is the fingerprint of an unmeasured green: a wide moisture, density, or size variance in the input becomes a wide color distribution in the output, and a muddled cup. The surface alone won't tell you. In sound coffee the whole-bean color and the ground-interior color sit close together; a wide gap between them means the outside ran ahead of the inside, the interiors are underdeveloped, and the cup will trade brightness for astringency. Push the roast faster to chase a bigger color delta and that gap widens. Reading color as a distribution, on both the whole bean and the grounds, turns roast consistency into something you can verify rather than taste-test after the fact.
Values to watch. Specialty work generally lives in the 70–150 Agtron region. Target your own development window per coffee; the actionable signal is the width of the distribution, the gap between whole bean and grounds, and how stable both are batch to batch, not any single textbook number.
What goes wrong when it drifts. A distribution that widens, or a peak that shifts between whole bean and grounds, flags an uneven roast, often traceable straight back to a green metric you didn't measure going in. Caught at the green stage, it's a setup decision. Caught only here, it's a batch you've already paid to roast.
Omix Plus reads color by near-infrared 2D imaging into the same Agtron-scale histogram as a reference color meter, accurate to ±0.5, on whole roasted beans and on grounds, closing the loop from green input to roasted output.
Reading the green before you roast
None of this asks you to roast differently. It asks you to stop assuming the inputs will be the same day to day, month to month, year to year. Everything above is information the green already carries; the only question is whether you read it before the roast or reconstruct it during or afterward from a cup that didn't land.
The reason these readings often get skipped isn't doubt that they matter. It's friction. Moisture, water activity, density, screen size, and color used to each require a separate instrument, with its own sample prep and its own calibration, so the green-side check becomes the step that quietly falls off the list.
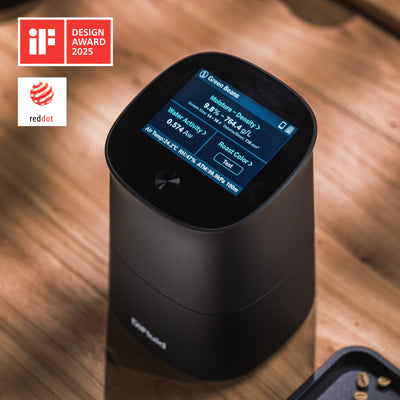
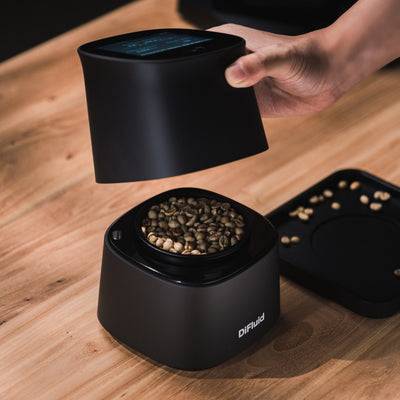
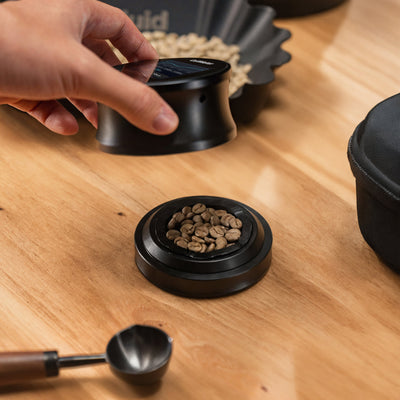
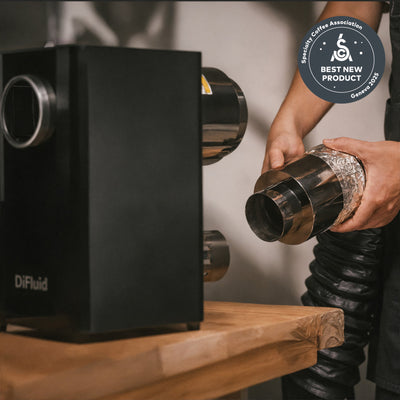
Omix Plus reads them from one sample in a single run.
Start roasting the beans you have, not the beans you think you have.


