


R2 Extract Complete Guide
Part 1: The device
What the parts are, how to calibrate it, and how to take a reading you can rely on.
What’s in the box
R2 Extract × 1
Coffee Spoon × 1
Protective Pouch × 1
Charging Cable × 1
Microfiber Cloth × 1
Device anatomy
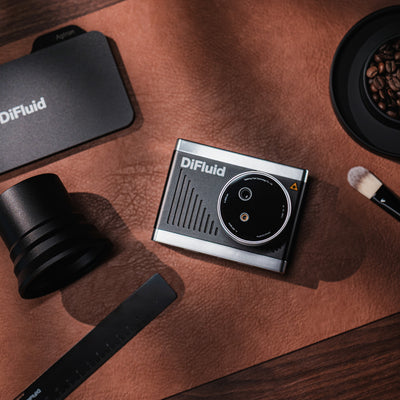
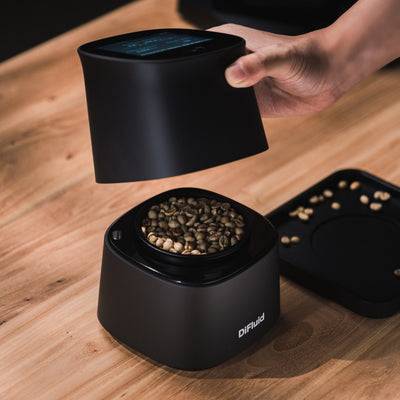
R2 Extract measures how much coffee is dissolved in a liquid by passing light through the sample and reading how far the light bends. Here is what each labeled part is and why it is there.

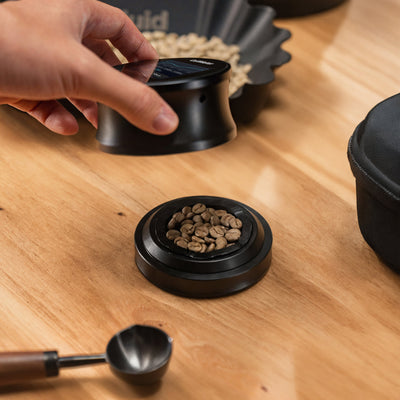
Sample dish - the shallow well on top, with the prism at its base. Every reading is taken here, so this is the surface that has to stay clean and dry.
Refractive index - the raw measurement: how far the light bends as it passes through the liquid. Shown in the top-left of the screen. Everything else on screen is derived from this one number.
Concentration - the large number, shown in TDS% (total dissolved solids). It is the refractive index converted into a strength figure you can actually use.
Temperature - the temperature of the sample the device is reading. It feeds the conversion, because refractive index changes with temperature.
Status - the row of icons: a drop when calibration is overdue, plus connection and battery indicators.
Button - the single control below the screen. It powers the device, runs a test, and starts calibration.
Charging port - USB-C on the base. The back panel carries the input rating.
How the number is worked out. R2 Extract reads refractive index directly, and the TDS% you see is calculated from that refractive index at the current temperature. The calculation is temperature-compensated, but that compensation assumes the liquid and the device have reached the same temperature. Putting hot coffee on a cold device will take longer to reach equilibrium, which makes the algorithm’s job much harder and the result less accurate. R2 Extract compensates for an imperfectly prepared sample, but it adds noise that shows up in your accuracy.
The button
| Gesture | What it does |
|---|---|
| Single tap | Powers on, or takes a reading when the device is already on. |
| Quick tap, then hold | Starts calibration. Think of it as a double-click where you hold the second press. Do it at speed, not as two separate presses. Release when “Zeroing” appears. |
| Double tap | Opens system information. |
| Hold | Powers off. |
Keep it clean
Anything that touches the sample has to be clean and dry. A film of oil (espresso crema is the worst for this) or coffee left from the last test will move the reading. Use the spoon that comes in the box, keep it clean, and reset the dish after every test.

Rinse the glass at the bottom of the sample dish with clean water.

Wipe the dish completely dry with a soft cloth or tissue before the next sample.
Calibration
Calibration zeroes the device against a baseline liquid so it knows what “no coffee” looks like. Do it at the start of a session. You have two choices for the baseline, and they trade accuracy against effort.
Brew water - spoon in the same water you brewed with. Your water’s own dissolved solids get zeroed out during calibration, so the number you read afterward refers directly to what the coffee alone contributed.
Distilled water - Distilled water is a true zero, so the conversion from refractive index to TDS comes out as accurate as possible. If you want to later calculate extraction, your brew water carries its own minerals, so you have to read that water’s TDS on its own and subtract it from your coffee result. Skip that step and you would be crediting the coffee with dissolved solids that actually came from the water.
Refractive index moves with temperature and with the type of solid dissolved in the liquid, so no conversion to TDS is perfectly clean. There is always a little noise in the number. Careful calibration, matched temperatures, and a subtracted water baseline all shrink it. How far you go depends on how much accuracy you need; More on that in Part 2.

Single-tap to power on the device.

Spoon brew water or distilled water onto the prism until it is covered. The amount of liquid does not matter but more liquid reduces the effect of evaporation.

Wait 5 seconds for the temperatures to equalize, then short-press and hold the button until “Zeroing” shows on screen. Release.

When the screen reads 0.00%, the baseline is set for the session.

Empty the dish and wipe it completely dry before your first coffee.
Measuring a sample
Refractive index is extremely sensitive, and the thing working against you most is evaporation. Hot coffee evaporates on the prism, which concentrates what is left and pushes the reading higher than the truth. Testing the same drop over and over does the same thing, a little at a time. The steps below are built around avoiding that.

Wait until the coffee is near room temperature before you measure. Single-tap to wake the device.

Stir the coffee thoroughly, then spoon it onto the prism and fill the dish. A larger volume loses proportionally less to evaporation, so the reading holds steadier.

Leave the coffee on the device for 5–10 seconds so the liquid and the prism come to the same temperature, then press the button. Refractive index shifts with temperature, so letting them equalize reduces noise.

The TDS% appears in a few seconds. For a second read, spoon on a fresh sample rather than testing the one already sitting on the prism.
A few more things: for espresso, for the most accurate readings, filter the oils out with a paper filter. It can be worth sacrificing accuracy for time to skip this step. Keep readings within the operating range of 5–40°C (41–104°F), and leave a few seconds between tests.
On-screen alerts
| Alert | Meaning |
|---|---|
| Drop icon (top-right) | Device needs calibration. |
| Zero Failed | Zeroing failed: dish not clean, water not at temperature, or a dirty prism. Re-clean and re-zero. |
| No Liquid | No sample detected in the dish. |
| Beyond Range | Concentration is above 30% TDS. |
| Test Error | Measurement failed. Re-clean and re-measure. |
| Numeric error code | Hardware fault. Contact DiFluid support. |
Specifications
| Specification | Value |
|---|---|
| Dimensions (L × W × H) | 88 × 36 × 16 mm |
| TDS range | 0–30% |
| TDS precision | ±0.02% |
| TDS accuracy | ±0.03% |
| TDS resolution | 0.01% |
| Refractive index range | 1.33299 – 1.38660 |
| Refractive index precision | ±0.00004 |
| Refractive index resolution | 0.00002 |
| Test time | ~4 seconds |
| Operating temperature | 5–40°C |
| Battery | 430 mAh Li-ion, non-removable |
| Charging | USB-C, 5V/0.3A |
| Water resistance | IP67 |
Part 2: R2 Extract in CoffeeOS
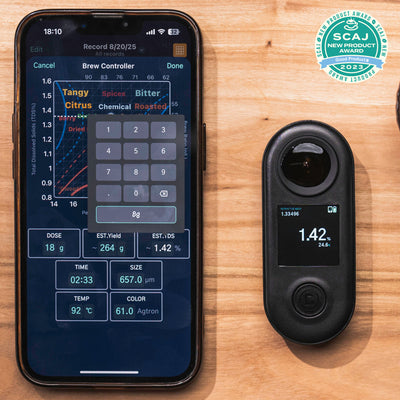
R2 Extract measures the concentration of your coffee, measured in percent of Total Dissolved Solids (TDS %) in the total beverage. CoffeeOS helps do the math to calculate the extraction %, and plot the brew on the Brewing Control Chart, to help visualize where your brew lands in terms of acidity, bitterness, and body.
Why measure TDS
TDS is strength: how much dissolved coffee is in the cup. On its own that is just a number. Alongside your dose, water, and yield, you can work out extraction: the % of the coffee beans that actually dissolved into the water.
Strength and extraction together make a single point that can be plotted on the Brewing Control Chart. The Brew Controller Tool helps you control your brews by guiding you to use the Brew Control Chart effectively. The Sensory Brew Control Chart is based on the latest research from UC Davis. As a rough guide:
- For more acidity, aim for a higher TDS and a lower extraction.
- For less acidity and more bitterness, aim for a higher TDS and a higher extraction.

This is also why a reading does not have to be lab-perfect to be worth taking. Plotted on the chart, even a slightly noisy number still tells you which way to move, whether that is grind, ratio, or temperature, to steer the cup toward what you want.
Entering a TDS reading
The device-import control sits just below the number pad. Tapping this icon will start listening to data sent by the device. Press the Test button on R2 Extract, and the reading drops straight into the field. Tap outside the menu to confirm, and the chart updates with the result.

Route A: Record a brew, then plot it
Use this when you have already brewed and want to see where the cup landed. Brew Recorder captures the brew; the Brew Controller plots it.
- Open Bean Manager, go to the Roasted tab, and pick or create the bean.
- Power on Microbalance or Microbalance Ti. CoffeeOS finds it from the home screen, or you can pair it through Device Center.
- In Brew Recorder, choose to either directly record your brewing action, or to build a recipe and follow it step by step.
- Assign the bean in the bottom controller so the session links to it.
- Tap Start, brew, tap Stop. Weight, time, and flow stream in live, and the bloom, pours, and swirls are marked automatically.

- Tap the Brew Controller icon
 at the bottom of the controller to open the Brew Controller tool and plot the brew there. Dose, water, and yield carry over. Tap the TDS field and pull it live from R2 Extract, or type it in. Extraction calculates, and the brew lands on the chart, still tied to the bean.
 - Swipe between the sensory, updated classic, and original charts. The sensory chart is based on filter coffee TDS ranges, so espresso defaults to the classic brew control chart.

Optional: Convert the recording to a recipe for a future step by step guided brew, by opening the top menu and selecting “Convert to recipe” from the brew result page.
Route B: Set a target, then dial it in
Use this when you know the cup you want and are working backward to it, or when you don’t want to record your brew. Brew Controller sets the target; R2 Extract tells you how close each attempt gets.
- Open Brew Controller and swipe to a chart.
- Enter what you know (dose, water, yield) and it estimates the rest.
- In Target Mode (pour-over), tap the exact point on the chart you want to hit. Based on an AI model trained on thousands of brews, the system recommends variables which can be turned into a recipe to follow in the Brew Recorder.

- Brew it, read the TDS, and enter it. The plotted point shows how close you came.
- Change one variable, like grinding finer to raise extraction, and measure again until the point sits where you wanted it.
Where your readings live
If you track your beans using the Bean Manager, you can link Brew Recorder and Brew Controller Sessions back to the bean by assigning those beans to the Session.

Bean Insights files every connected session by tool. Your latest TDS sits in the Brew Controller folder, your Roast Color Analyzer results under Roast Color Analysis, and so on.

Recipes you saved are under Selected Recipes, one tap away from brewing again. All of this data can be shared to others by tapping share from the top menu of any Tool.
